- 教育
- กลยุทธ์การเทรด
- การเชี่ยวชาญกลยุทธ์สามวิธี
การเชี่ยวชาญกลยุทธ์สามวิธี
เพิ่มประสิทธิภาพการเทรดของคุณ! เรียนรู้กลยุทธ์สามวิธีและเริ่มจับจังหวะการเคลื่อนไหวของตลาดครั้งใหญ่ได้อย่างง่ายดาย เตรียมพร้อมที่จะทำให้การเทรดง่ายขึ้นและได้ผลลัพธ์เชิงบวกบ่อยขึ้น
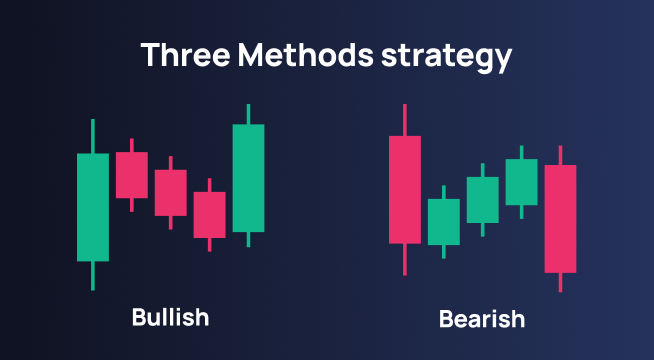
- โครงสร้างกลยุทธ์: เทียนยาว เทียนสั้น เทียนยาวอีกอัน
- เงื่อนไขตลาด: ทิศทางแนวโน้มที่ชัดเจน มั่นคง
- จุดเข้า: หลังจากที่แท่งเทียนสุดท้านปิดนอกแท่งเทียนสั้น
- ความเสี่ยง: ตัวทริกเกอร์ผิดพลาดในแนวโน้มที่ผิดและไม่มั่นคง
- เครื่องมือเพิ่มเติม: ใช้ Moving Averages, RSI และ MACD
โครงสร้างของกลยุทธ์สามวิธี
กลยุทธ์สามวิธีเป็นรูปแบบแท่งเทียนที่บ่งบอกถึงการต่อเนื่องของแนวโน้มปัจจุบัน ประกอบด้วยแท่งเทียนยาว ตามด้วยแท่งเทียนสั้นหลายแท่งที่ล้อมรอบกรอบของแท่งเทียนยาวก่อนหน้าอย่างสมบูรณ์ และจบลงด้วยแท่งเทียนยาวอีกแท่งหนึ่งที่ยืนยันการต่อเนื่องของแนวโน้ม
เงื่อนไขตลาดที่เหมาะสม
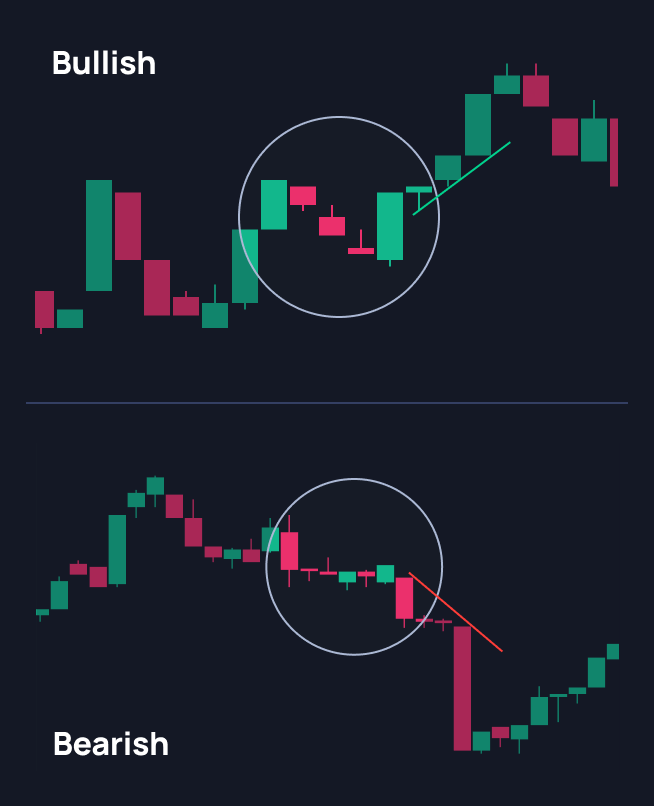
กลยุทธ์นี้จะทำงานได้ดีที่สุดในสภาวะแนวโน้มที่มั่นคงและชัดเจน โดยที่การเคลื่อนไหวของตลาดมีทิศทางที่ชัดเจน เพิ่มโอกาสที่แนวโน้มจะดำเนินต่อไปหลังจากรูปแบบเกิดขึ้นแล้ว
ระบุจุดเข้าที่ถูกต้อง
แนะนำให้เข้าหลังจากแท่งเทียนสุดท้ายของรูปแบบปิดนอกช่วงของแท่งเทียนชุดเล็ก ซึ่งยืนยันว่าตลาดพร้อมที่จะดำเนินต่อไปในทิศทางของแนวโน้มปัจจุบัน
การดำเนินการเทรด
สัญญาณขาขึ้น: กด "ซื้อ" เมื่อรูปแบบขาขึ้นสามวิธีเกิดขึ้นหลังจากแนวโน้มขาลง ซึ่งบ่งชี้ถึงการกลับตัวที่เป็นไปได้ในทิศทางขาขึ้น
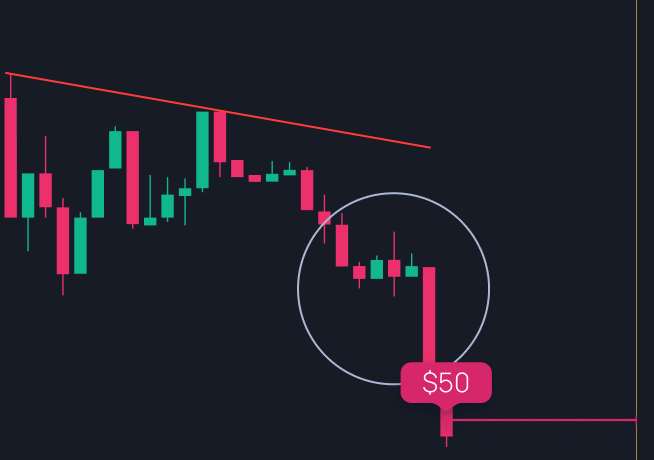
สัญญาณขาลง: กด "ขาย" เมื่อรูปแบบขาลงสามวิธีเกิดขึ้นหลังจากแนวโน้มขาขึ้น ซึ่งบ่งชี้ถึงการกลับตัวเป็นขาลงที่เป็นไปได้
ความเสี่ยงและข้อจำกัด
ความเสี่ยงหลักเกี่ยวข้องกับความเสี่ยงที่อาจเกิดรูปแบบที่ผิดพลาด โดยเฉพาะอย่างยิ่งในตลาดที่ผันผวนหรือแนวโน้มที่ไม่แน่นอน สิ่งสำคัญคือต้องใช้กลยุทธ์นี้ควบคู่ไปกับการวิเคราะห์ตลาดโดยรวม
เครื่องมือชี้วัดเพิ่มเติมเพื่อเพิ่มประสิทธิภาพของการเทรด
ในการเพิ่มโอกาสในการประสบความสำเร็จ ให้ใช้ตัวบ่งชี้และเครื่องมือวิเคราะห์เหล่านี้เพื่อเสริมกลยุทธ์สามวิธี:
-
Moving Averages: ช่วยกำหนดทิศทางแนวโน้มโดยรวมและความแข็งแกร่งของแนวโน้ม
-
RSI (Relative Strength Index): ระบุสภาวะการซื้อหรือขายได้อย่างง่ายดายและเตือนถึงการกลับตัวของหลักการเป็นหลัก
-
MACD (Moving Average Convergence Divergence): ช่วยตรวจจับการเปลี่ยนแปลงของโมเมนตัมและความแข็งแกร่งของแนวโน้ม พร้อมทั้งให้คำแนะนำสำหรับจุดเข้าหรือจุดออก
ลงมือทำเลยตอนนี้: ดื่มด่ำไปกับการเทรดด้วยกลยุทธ์สามวิธี ทดสอบ สัมผัสความแตกต่าง และพัฒนาทักษะของคุณ ทุกการเทรดคือก้าวสู่ความเชี่ยวชาญ